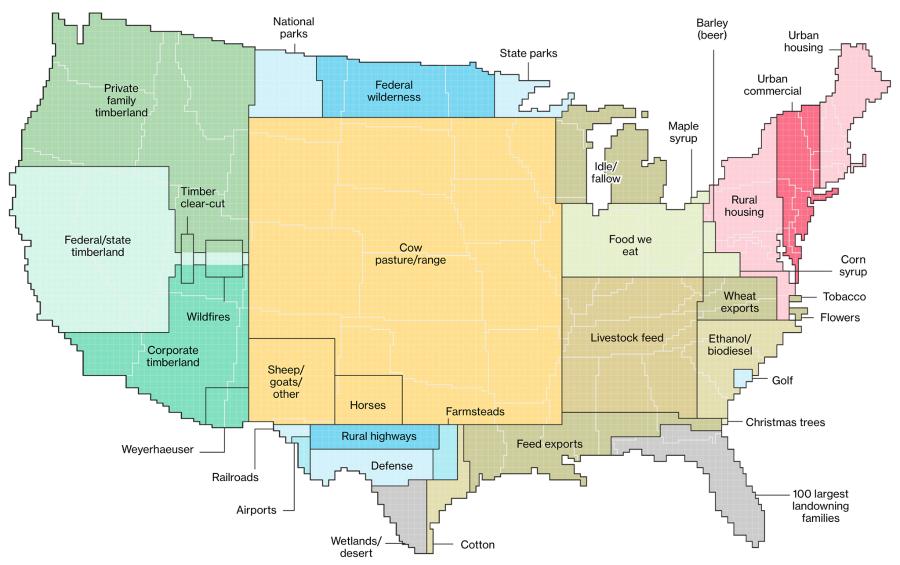
America's land use is very diverse and scattered throughout the states. By using surveys, satellite images and categorizations the U.S. Department of Agriculture divides the U.S. into six major types of land. Bloomberg took that data, and created the How America Uses its Land infographics. The infographics use the map to show both how much of the country is made up of a certain land use, and where the majority of it is located.
Using surveys, satellite images and categorizations from various government agencies, the U.S. Department of Agriculture divides the U.S. into six major types of land. The data can’t be pinpointed to a city block—each square on the map represents 250,000 acres of land. But piecing the data together state-by-state can give a general sense of how U.S. land is used.
Comments (1)
А сто землевладельческих семей, согласно этой инфографике, не используют эту землю ни для одной из указанных категорий использования? И Аляска непонятно куда делась 🙂